
Calculating the true cost of the products your business sells becomes far easier with a cost of goods sold template already designed and ready to use. Instead of building a calculation sheet from scratch, a ready-made Excel template gives you a clear, organized layout you can fill in with your production and inventory costs in minutes. Below you’ll find 5 free, downloadable cost of goods sold templates in Excel format, suitable for accountants, business owners, and finance teams.
What Is a Cost of Goods Sold Template?
A cost of goods sold template, often called a COGS template, is a pre-formatted Excel spreadsheet used to calculate the direct costs associated with producing or acquiring the goods a business sells during a given period. Rather than building a calculation sheet from scratch, a ready-made template gives you a structured layout already built with fields for beginning inventory, purchases, and ending inventory. These templates are used by accountants, business owners, and finance teams who need a clear, consistent way to calculate the figure that feeds directly into a company’s income statement.
Why You Need a Cost of Goods Sold Template: Key Benefits
- Saves calculation time: A ready-made structure means you can focus on entering figures instead of building a spreadsheet from scratch.
- Reduces errors: Built-in formulas minimize the chance of miscalculating the final COGS figure.
- Supports accurate reporting: A properly calculated COGS figure is essential for accurate gross profit and income statements.
- Simplifies tax preparation: An organized COGS calculation makes it easier to report accurate figures at tax time.
- Easy to customize: Editable fields let you quickly adapt the template to your specific business and inventory categories.
- Free and reusable: Download once and reuse the same structure for every reporting period.
What’s Included in the Cost of Goods Sold Template
- Beginning inventory field: Space to record the value of inventory at the start of the period.
- Purchases or production costs: A field for tracking additional inventory acquired or produced during the period.
- Ending inventory field: Space to record the value of inventory remaining at the end of the period.
- Built-in COGS formula: An automatic calculation that combines these figures into the final cost of goods sold.
- Period or date fields: Space for identifying the specific reporting period the calculation covers.
- Notes section: An area for additional details about specific cost categories or adjustments.
Who Should Use These Templates?
- Small business owners calculating COGS without dedicated accounting software.
- Accountants and bookkeepers preparing financial statements for clients.
- Retailers and manufacturers tracking the direct costs of the products they sell.
- Finance students learning how COGS is calculated and used in financial reporting.
- Startup founders building their first set of financial statements.
- Tax preparers organizing figures needed for business tax filings.
How to Start Using the Template in 3 Simple Steps
- Step 1 — Choose a template style: Browse the 5 options below and select the format that best fits your business.
- Step 2 — Enter your inventory and cost figures: Fill in beginning inventory, purchases, and ending inventory.
- Step 3 — Review the calculated result: Check the automatically calculated COGS figure and use it in your financial statements.
Cost of Goods Sold vs. Operating Expenses
While both figures reduce a company’s overall profit, cost of goods sold and operating expenses represent different types of costs. Cost of goods sold covers the direct costs of producing or acquiring the specific goods a company sells, such as materials and direct labor. Operating expenses, by contrast, cover the broader costs of running the business that aren’t tied directly to production, such as rent, utilities, and administrative salaries. Separating these two categories correctly is important because COGS is subtracted from revenue to calculate gross profit, while operating expenses are subtracted later to calculate net income.
Customizing the Template for Your Business
These templates are designed to be a flexible starting point rather than a fixed format. You can add your company’s specific inventory categories, adjust the formulas to account for shipping or handling costs, or build in additional fields for tracking costs by product line. Since the templates are provided in editable Excel format, most adjustments take only a few minutes and let you tailor the calculation to fit your particular business needs.
Choosing the Right Format
With 5 different templates available, choosing the right one depends on the complexity of your inventory and how detailed a calculation you need. A simpler template works well for straightforward retail businesses, while a more detailed manufacturing-focused template suits businesses that need to account for raw materials and production costs separately. Reviewing each option before committing to one can help you find the layout that best fits your accounting needs.
Common Mistakes to Avoid
- Including overhead costs: COGS should not include general operating expenses like rent or administrative salaries.
- Inconsistent inventory valuation: Use the same inventory valuation method consistently across periods.
- Forgetting to update ending inventory: An accurate count at period end is essential for a correct calculation.
- Manual calculation errors: Use built-in formulas rather than manually calculating the final figure.
- Not reconciling with physical counts: Periodically verify inventory figures against actual physical counts.
Tips to Get the Most Out of Your Cost of Goods Sold Template
- Update the template every reporting period rather than calculating COGS only once a year.
- Keep supporting documentation for purchases and inventory counts in case of an audit.
- Double-check formulas after making any structural changes to the spreadsheet.
- Compare COGS trends over time to spot rising costs or pricing issues early.
- Review the calculation with an accountant if you’re unsure about specific cost categories.
How COGS Affects Gross Profit and Pricing
Cost of goods sold directly determines a company’s gross profit, since gross profit is calculated by subtracting COGS from total revenue. A business with a high COGS relative to its revenue has a thinner gross margin, which can limit how much is available to cover operating expenses and generate net profit. Understanding this relationship helps business owners set prices that adequately cover production costs while still leaving room for a healthy profit margin, and it makes COGS one of the most closely watched figures when evaluating a product line’s overall profitability.
Calculating COGS for Service-Based Businesses
While cost of goods sold is most commonly associated with businesses that sell physical products, some service-based businesses calculate a similar figure known as cost of services or cost of revenue. This figure typically includes direct labor and materials tied to delivering the service, such as a consultant’s billable hours or the supplies used in providing a service. Although the underlying formula differs slightly from a traditional product-based COGS calculation, the same principle of separating direct costs from general overhead still applies, and many of these templates can be adapted for that purpose.
Using COGS in Inventory Management Decisions
Beyond its role in financial reporting, tracking cost of goods sold over time gives business owners valuable insight into inventory management and purchasing decisions. A rising COGS trend that isn’t matched by a corresponding increase in sales volume can signal supplier price increases, inefficient purchasing, or inventory shrinkage that deserves closer attention. Reviewing COGS alongside inventory turnover rates on a regular basis helps businesses identify slow-moving stock, negotiate better terms with suppliers, and make more informed decisions about how much inventory to keep on hand.
Preparing COGS Figures for Tax Filings
Cost of goods sold plays an important role in business tax filings, since an accurately calculated COGS figure directly reduces the taxable income reported by a business. Keeping detailed, well-organized records throughout the year, rather than trying to reconstruct figures at tax time, makes the filing process considerably smoother and reduces the risk of errors that could trigger questions from tax authorities. Many business owners find it helpful to reconcile their COGS template against their accounting software or tax preparer’s records before filing to confirm the figures match.
Choosing an Inventory Valuation Method
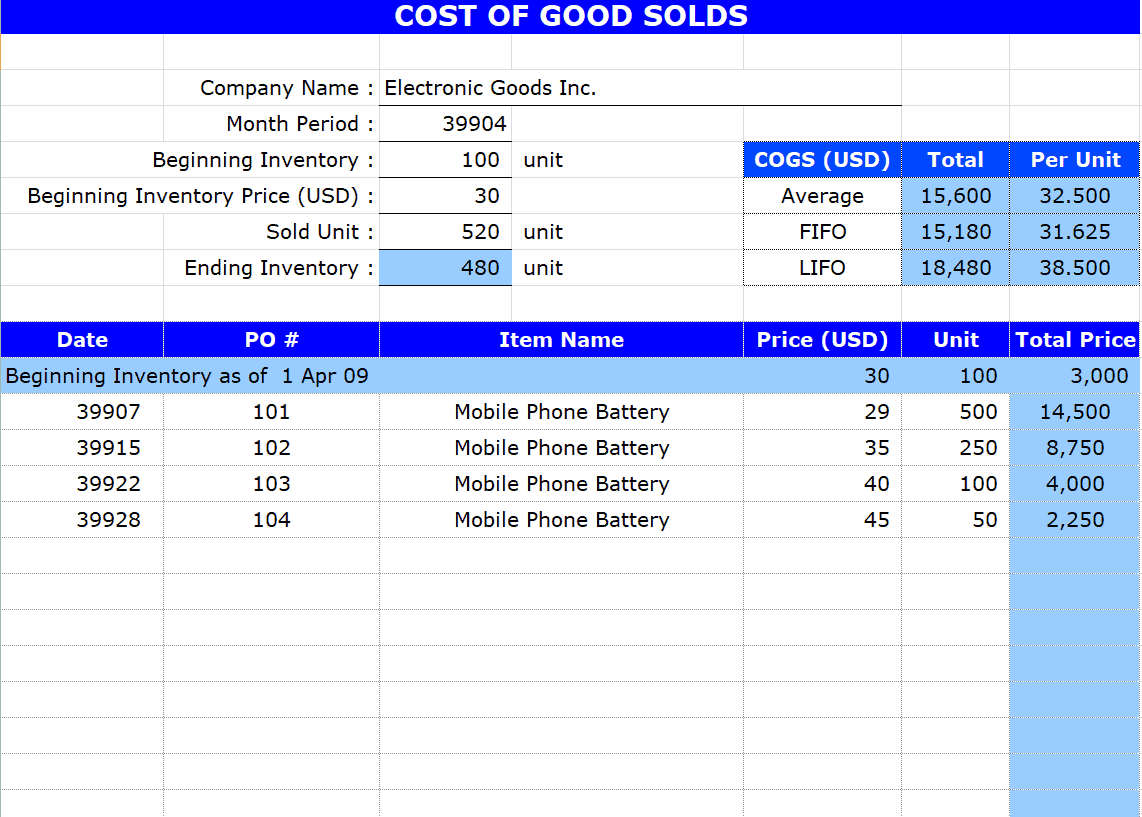
The method a business uses to value its inventory, such as FIFO (first-in, first-out), LIFO (last-in, first-out), or weighted average cost, directly affects the resulting cost of goods sold figure, especially during periods of fluctuating prices. FIFO typically results in a lower COGS and higher reported profit during periods of rising prices, since older, cheaper inventory is counted as sold first, while LIFO has the opposite effect. Choosing a valuation method usually depends on a combination of factors including industry norms, tax implications, and how closely inventory costs actually fluctuate, and most businesses stick with the same method consistently once selected to keep their financial reporting comparable across periods.
Comparing COGS Across Multiple Product Lines
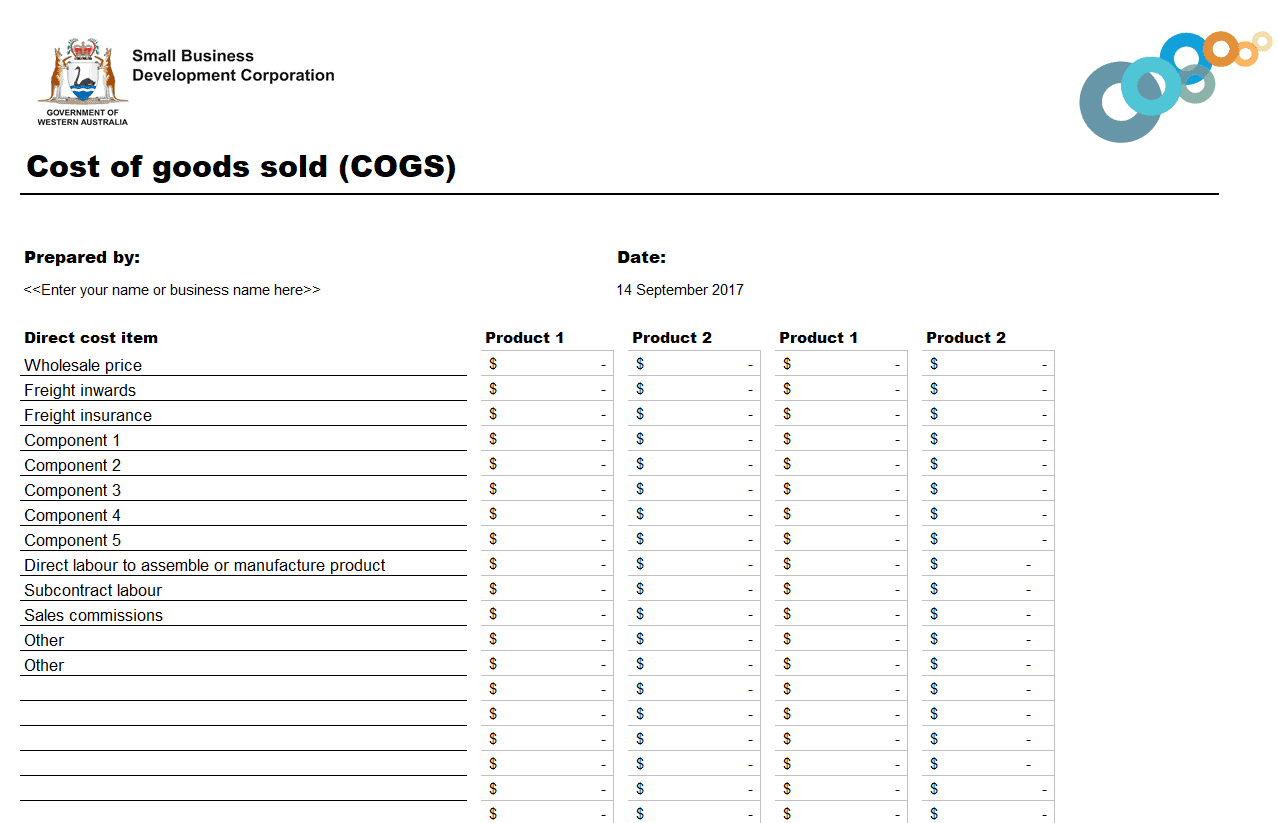
Businesses that sell multiple products or product lines often benefit from calculating cost of goods sold separately for each category rather than relying on a single combined figure. Breaking down COGS by product line makes it much easier to identify which products carry the healthiest profit margins and which may be underpriced relative to their production costs. This level of detail can inform decisions about which products to promote more heavily, which to reprice, and which might no longer be worth carrying if their margins have become too thin to justify the shelf space or production effort involved.
Download Cost of Goods Sold Excel Templates Here
Sample Cost of Goods Sold Excel Template
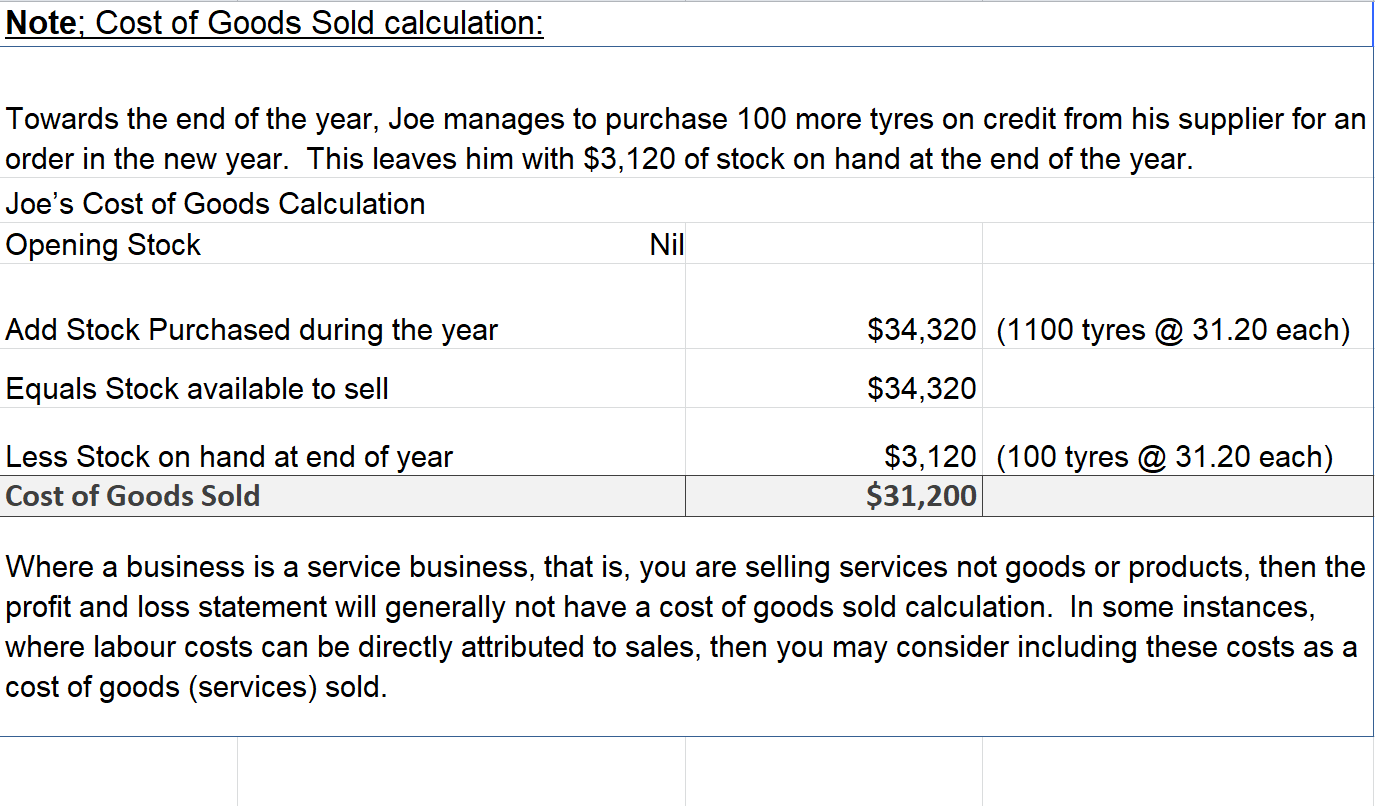
Cost of Goods Sold Excel Calculation Template
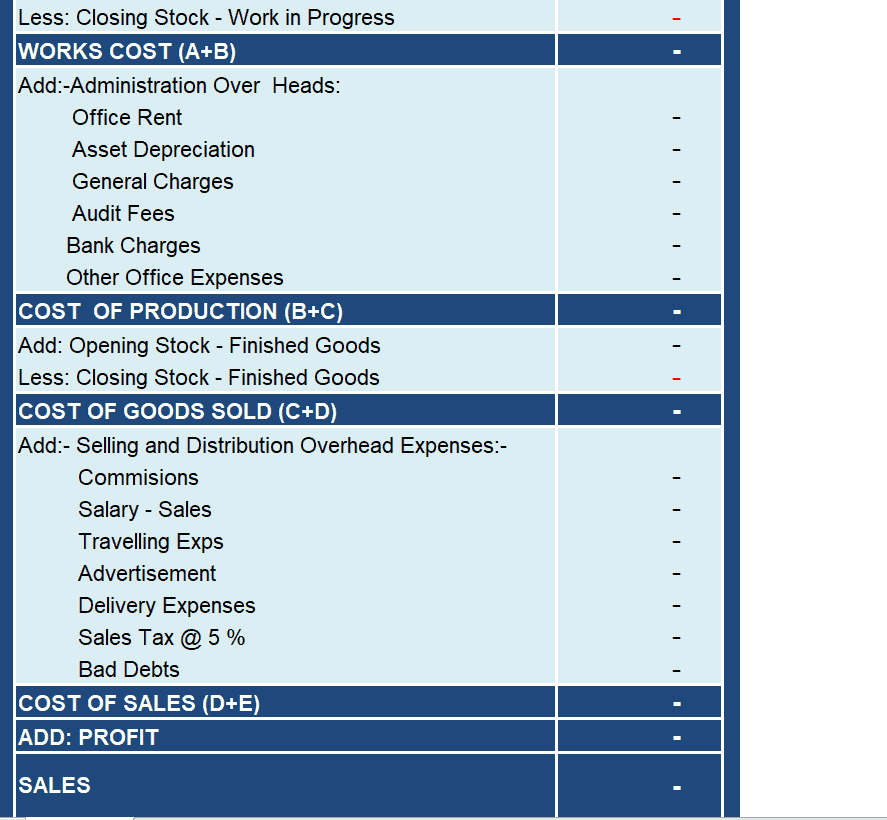
Example Cost of Goods Manufactured and Sold Template
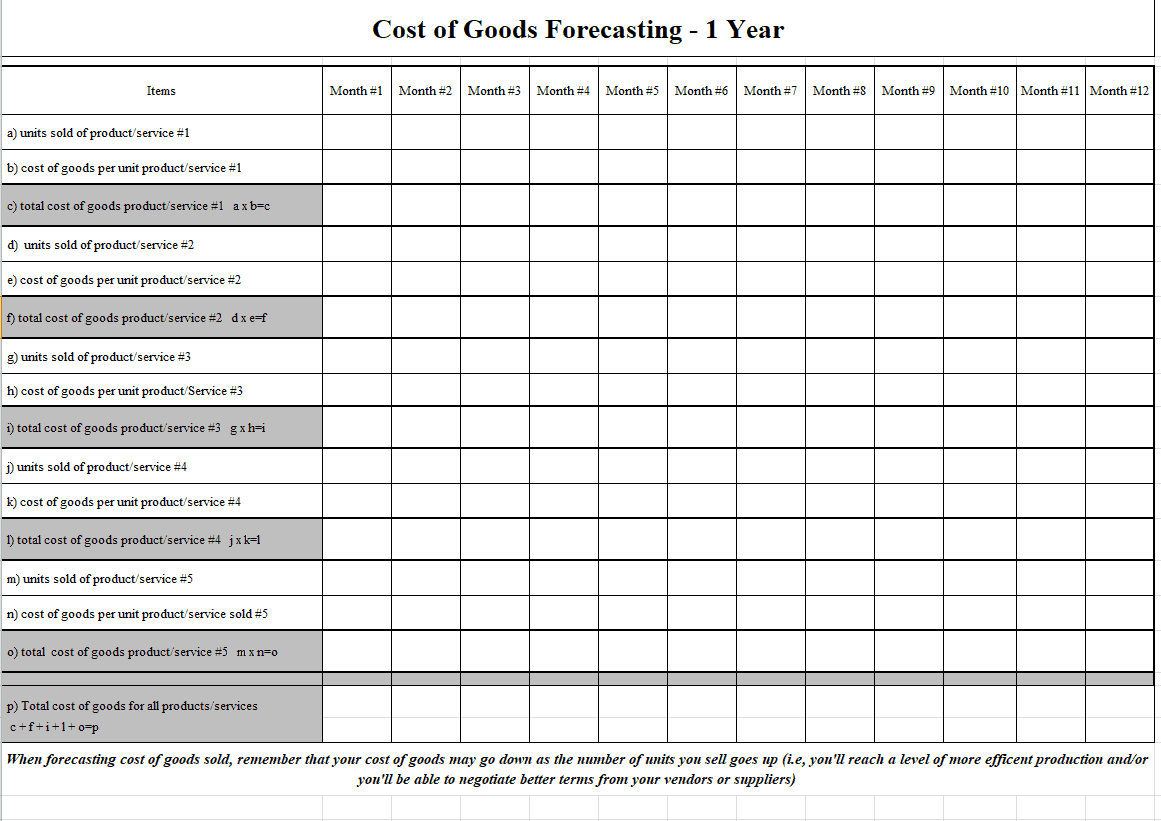
First Year’s Cost of Goods Sold Forecasting Template
Example Cost of Goods Sold Excel Template
Frequently Asked Questions
Are these cost of goods sold templates free to download?
Yes, all 5 cost of goods sold templates on this page are free to download and use.
What file format are these templates available in?
These templates are available in Excel format, making them easy to edit and customize with formulas.
Can I customize the fields on these templates?
Yes, since the templates are fully editable, you can add your own inventory categories, cost fields, and formulas.
What’s the difference between COGS and operating expenses?
COGS covers the direct costs of producing or acquiring goods sold, while operating expenses cover broader costs like rent and administrative salaries.
Can small businesses use these templates instead of accounting software?
Yes, these templates work well for small businesses that need a simple way to calculate COGS without dedicated software.
How often should I calculate cost of goods sold?
It’s best to calculate COGS every reporting period, such as monthly or quarterly, rather than only once a year.

You must be logged in to post a comment.