
Use break even Excel templates to estimate the sales volume needed to cover defined fixed and variable costs under explicit assumptions. This page contains layout examples and links to original sources, rather than a hosted editable Word or Excel file.
Layout examples and source links
These are layout previews and links to original sources, rather than hosted editable downloads. Check each source’s current availability, format and terms.
See Break Even Excel Templates Here
Break Even Analysis Excel Template
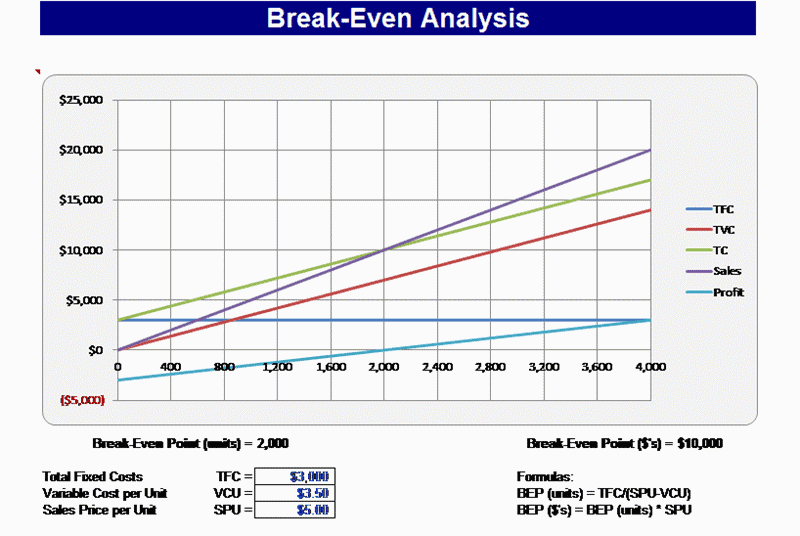 View original source for Break Even Analysis Excel Template
Business Break Even Excel Template
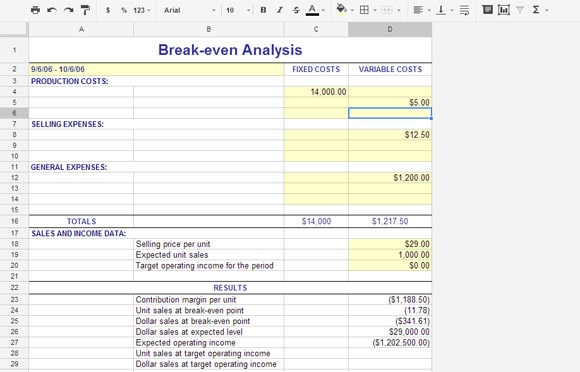
View original source for Business Break Even Excel Template
Sample Break Even Excel Template
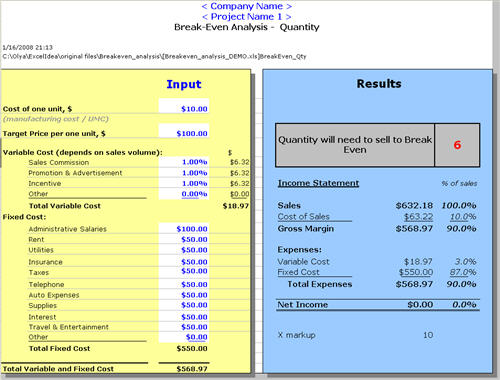
Break-even analysis depends on contribution margin and a stated period. It is not the same as recovering every cash outlay or earning a target return. A single-product model also assumes a consistent selling price and variable cost within the relevant range.
Choose a suitable template
Choose a calculator for the model it actually supports, not just the title on the preview. Identify its inputs, outputs, time periods, and assumptions. A fixed-rate model, for example, may not support changing rates or irregular timing without substantial revision. If the downloaded resource does not expose or explain its formulas, treat the displayed result cautiously and compare it with an independent worked example.
Important details to prepare
Analysis period
Choose a monthly, annual, or project period and use it consistently for costs and volumes. Mixing annual rent with monthly sales distorts the result. Record the source and effective date of this input. A calculator can process an unsupported assumption perfectly and still produce a result that is unsuitable for the decision being considered.
Selling price
Use the relevant net selling price per unit and document discounts. Keep currency and the meaning of one unit consistent. Check the unit and time basis before using the value. Annual, monthly, daily, percentage, and decimal inputs are not interchangeable merely because the worksheet accepts a number.
Variable cost
Include costs that vary with the defined unit under the model. Avoid treating all costs as variable merely because they fluctuate. Use a simple baseline and retain it before changing this assumption. The comparison should explain the effect of the change rather than combining several unexplained changes into one attractive result.
Fixed cost
Include fixed costs for the analysis period and state important exclusions. Explain step changes if capacity increases would add fixed costs. Trace how the input reaches the result and check whether the formula range includes all relevant periods or observations. Pay particular attention to copied formulas and inserted rows.
Contribution margin
Calculate price less variable cost per unit. A zero or negative margin does not produce a normal positive break-even volume. Label the output in terms that describe what was calculated. Do not replace a qualified modeled result with a broader claim that the calculation cannot support.
Sensitivity
Compare plausible price, volume, and cost scenarios. Multiple products require an explicit sales-mix assumption rather than a casual average price. Keep the scenario date and assumptions with the result when sharing it. Someone reading only the last page should still be able to understand the principal limitations of the estimate.
How to complete the template
Create a baseline before trying alternatives. Enter a complete, internally consistent set of inputs, save the assumptions, and label the resulting scenario. Change one meaningful input at a time when investigating its effect. Keep units, rates, dates, and periods aligned. Distinguish a modeled estimate from an actual contractual amount, approved benefit, or guaranteed outcome; those require confirmation from the responsible source.
Worked example
A product sells for 50 with variable cost of 30, giving contribution margin of 20 per unit. Monthly fixed costs of 4,000 imply break-even at 200 units and revenue of 10,000 under the simplified assumptions. At 150 units, contribution is 3,000 and the model shows a 1,000 loss before any excluded items. Round required whole-unit sales upward where necessary.
Check accuracy before use
Check formulas with a small example that can be calculated by hand. Review zero values, missing inputs, unusual dates, and any denominator that could become zero. Confirm that percentage inputs are stored as intended rather than as values one hundred times too large. Inspect the final period or boundary case as well as the first result. A realistic-looking chart is not a substitute for a reliable calculation.
Related resources for the next step
Use pricing model templates to review selling-price assumptions.
Use cost of goods sold templates to support product-cost inputs.
Use pro forma budget templates to compare the result with a wider forecast.
Authoritative guidance
OpenStax explains break-even units using fixed costs divided by contribution margin per unit, and break-even revenue using the contribution margin ratio. See OpenStax break-even calculations.
