
Use sales funnel templates to measure how a defined audience moves through comparable stages from awareness toward a completed sale.
Editable downloads and previews
Use the file links where provided. Links labeled “View original source” open another website; check its current format, availability and terms. A preview image alone is not an editable document.
Template previews and source links
Sales Funnel Template Example
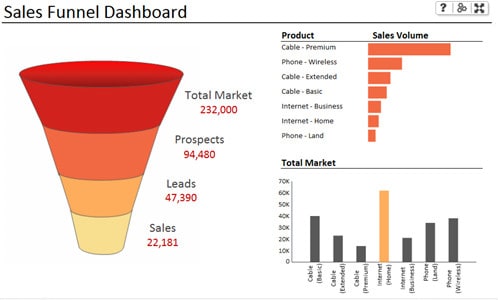 Download Sales Funnel Template Example (ZIP)
Sales Funnel PowerPoint Template
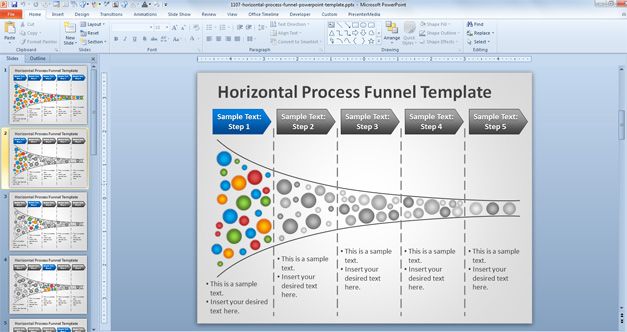 View original source for Sales Funnel PowerPoint Template
Sales Funnel Template Example
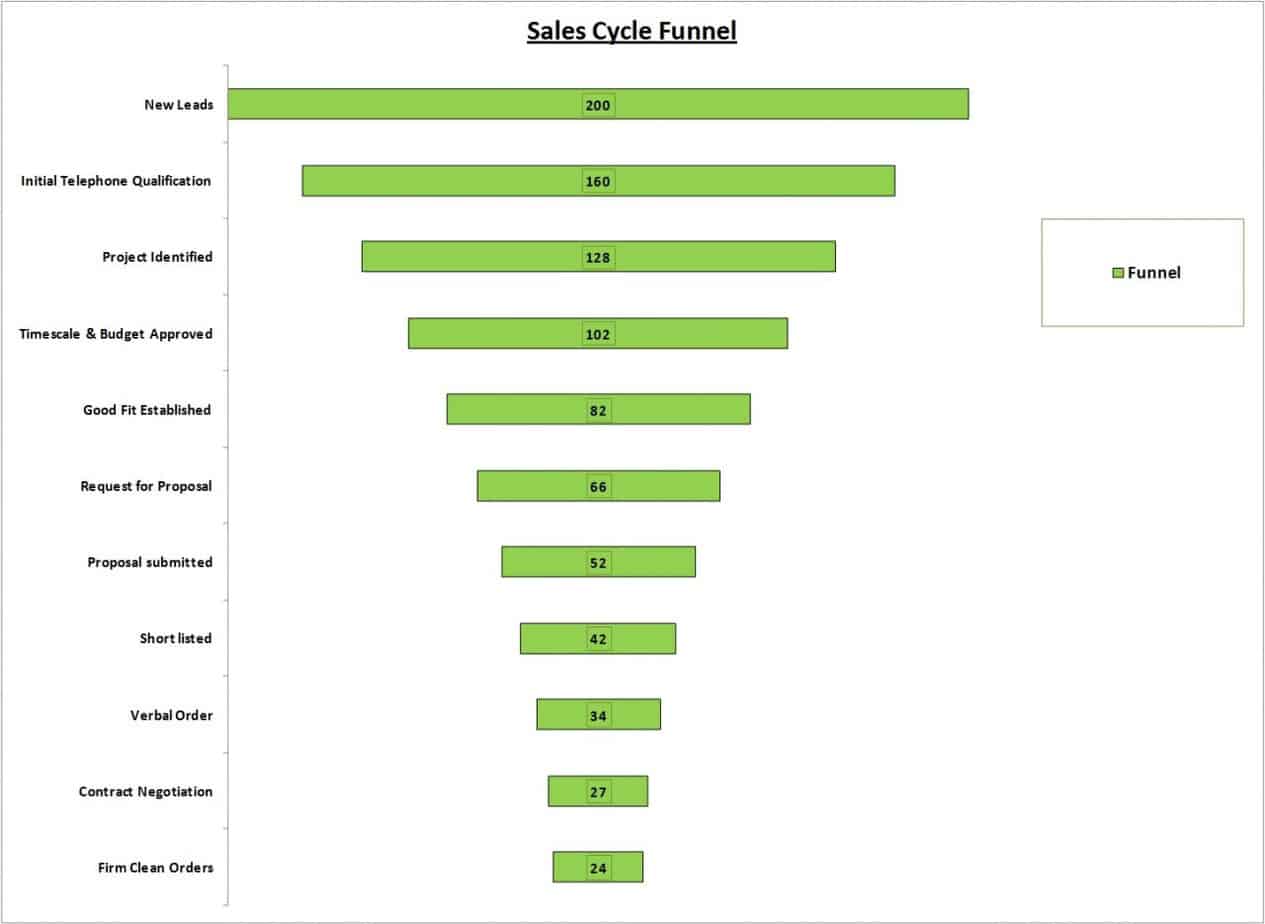 View original source for Sales Funnel Template Example
A sales funnel summarizes conversion across stages or cohorts. It differs from a list of individual open opportunities. Define stage entry rules and counting periods so a change in conversion reflects customer behavior rather than inconsistent reporting.
Choose a suitable template
Choose a sales worksheet by the management question it answers. A funnel measures conversion across defined groups, while a pipeline tracks individual opportunities and their next actions. Agree the definitions before collecting data. Avoid treating every contact as an equally qualified opportunity or presenting a planning forecast as contracted revenue.
Important details to prepare
Audience and cohort
Define which leads or prospects enter the analysis and during what period. Avoid mixing new leads with an unrelated stock of older contacts. Use a consistent unit and scope so that the entry can be compared with other records. Different contacts or orders should not be merged merely because they belong to the same company.
Stage definitions
Write an observable rule for each stage, such as qualified inquiry or completed purchase. A vague interested label is hard to count consistently. Identify who is responsible for keeping the detail current. A shared worksheet still needs clear ownership if it is to support timely action.
Stage counts
Choose whether counts represent unique people, accounts, or opportunities. Remove duplicates and explain how repeat purchases are treated. Base the entry on an observable customer event or an explained definition. Optimistic wording should not substitute for evidence of progress.
Conversion rates
Divide the relevant downstream count by the correct upstream count. Handle a zero denominator explicitly and label whether the rate is stage-to-stage or overall. Label assumptions and calculations clearly. A planning estimate can be useful without being described as a committed sale or a guaranteed result.
Time and source
Track channel and elapsed time where data supports it. Different channels or sales cycles may need separate comparisons. Connect the measure with a specific next action or question. The purpose is to improve decisions and follow-up rather than to produce a more elaborate report.
Actions
Investigate the largest meaningful drop-off and choose a specific improvement. A lower conversion rate is a signal to investigate, not proof of a particular cause. Review the history when updating status. Keeping meaningful changes visible helps explain delays and avoids a misleading picture created by repeatedly resetting dates.
How to complete the template
Establish a consistent unit of analysis, period, and ownership rule. Record source information and observable stage criteria, then update entries as customer evidence changes. Keep actual wins, open opportunities, and assumptions distinguishable. Use the same counting method when comparing teams or channels; otherwise an apparent improvement can come from a changed definition rather than stronger performance.
Worked example
A cohort contains 200 qualified inquiries, of which 60 book demonstrations and 15 buy. Inquiry-to-demo conversion is 30%, demo-to-sale conversion is 25%, and overall inquiry-to-sale conversion is 7.5%. The team checks that all counts refer to the same cohort and follow-up window before comparing them with another channel.
Check accuracy before use
Review duplicates, stale entries, unsupported probabilities, and close dates that move repeatedly without new evidence. Check conversion denominators and make sure comparisons use compatible periods or cohorts. Ask what practical customer action supports each stage. A colorful dashboard should help the team investigate and act, not conceal uncertainty behind precise-looking percentages.
Related resources for the next step
Use sales plan templates to connect funnel findings with planned actions.
Use sales call logs to maintain supporting customer activity.
Use dashboard templates to display consistently defined conversion measures.
