
Use spider chart templates to compare several dimensions on a radar-style chart using consistent scales and an explained scoring method.
Download Five Editable Spider Chart Templates
Select a preview to see the full layout.
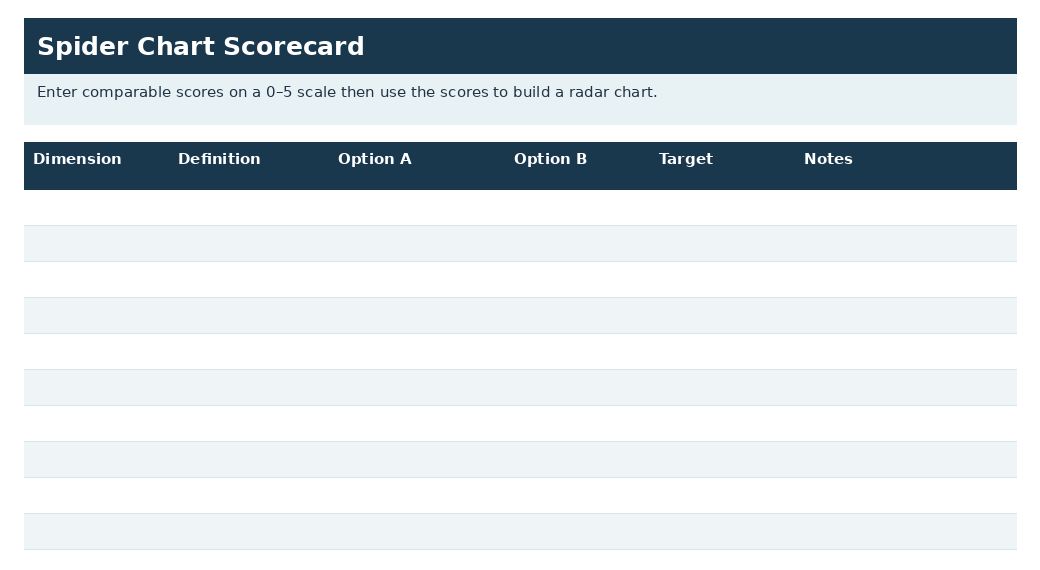
Spider Chart Scorecard Template
Enter comparable scores on a 0–5 scale then use the scores to build a radar chart.
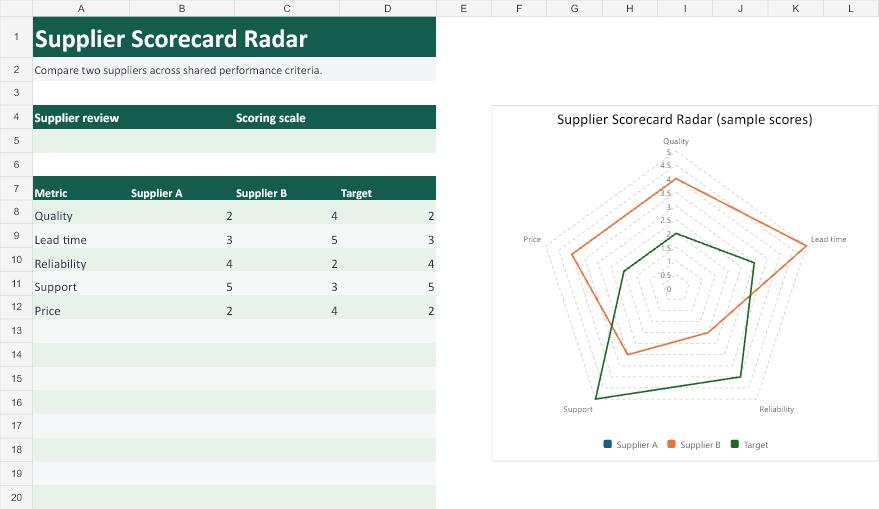
Supplier Scorecard Radar
Compare two suppliers across shared performance criteria.
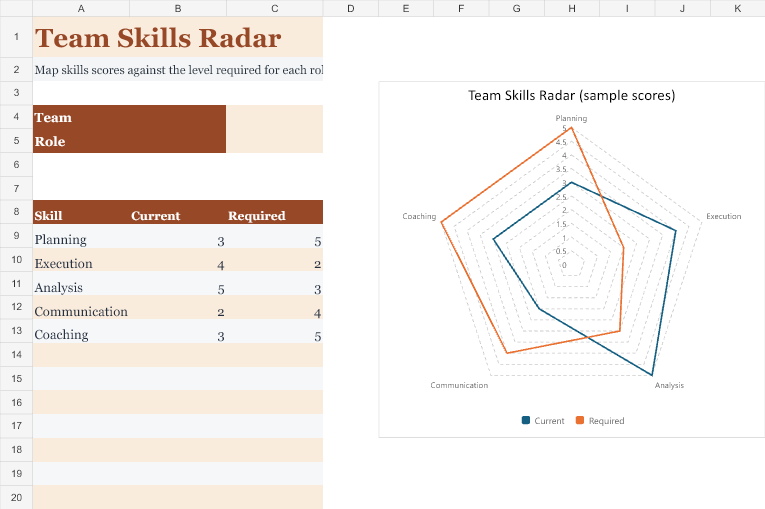
Team Skills Radar
Map skills scores against the level required for each role.
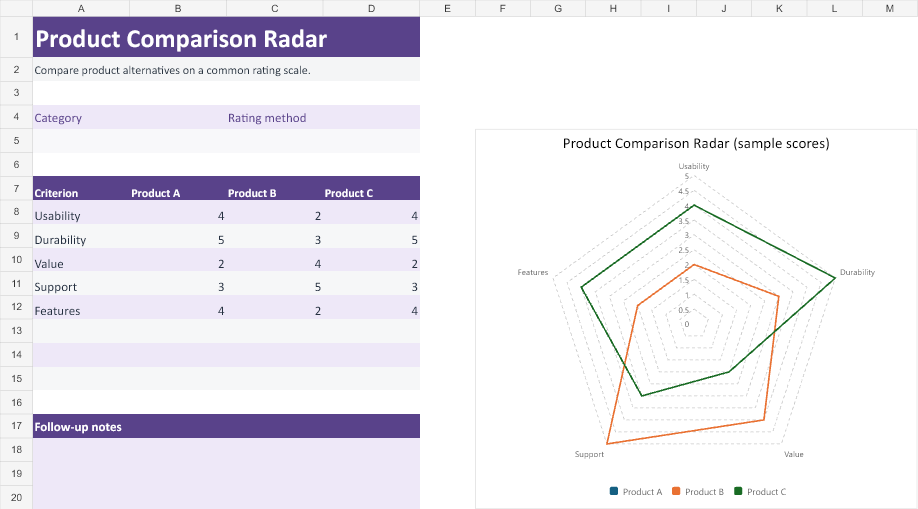
Product Comparison Radar
Compare product alternatives on a common rating scale.
Project Health Radar
Show delivery, budget, risk, quality, and stakeholder scores together.
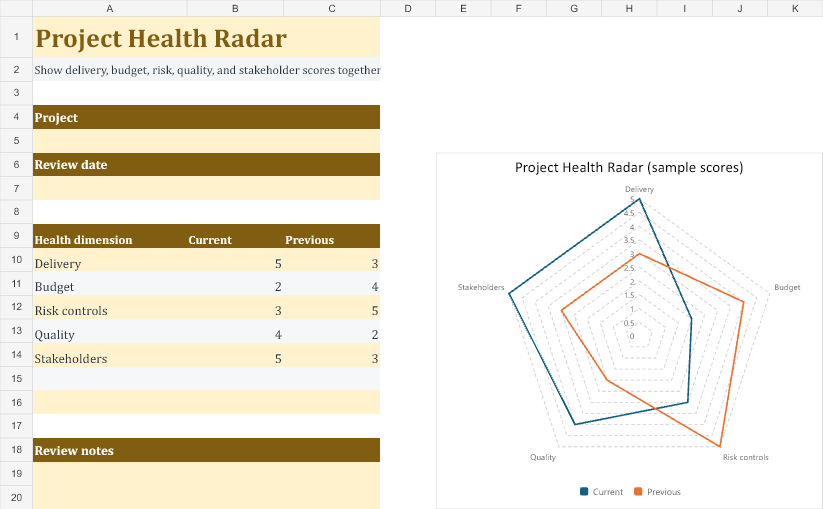
A spider chart, also called a radar chart, can show a profile across dimensions. Its shape depends on axis order and scale choices, so it should not be treated as an objective overall score by appearance alone. Use a table or another chart when precise comparisons are the main purpose.
Choose a suitable template
Choose a spider chart only when a multi-dimensional profile is useful to the reader. If the goal is precise ranking or comparing one measure, a table or simpler chart may be clearer. Define the dimensions and scoring method before selecting colors or shapes. A visually impressive polygon does not make the underlying assessment objective.
Important details to prepare
Dimensions
Choose distinct, relevant measures and avoid mixing unrelated ideas merely to create a symmetrical chart. Define the measure in terms the audience can understand and use consistently. A broad label needs a supporting explanation if different reviewers might score it differently.
Scale
Use consistent direction and comparable scales. Explain any normalization so that a larger plotted value has a clear meaning. Check the scale and direction before plotting. Comparable-looking axes can still hide incompatible units or reversed meanings.
Scores
Use supported observations or an explicit scoring rubric. Distinguish measured data from subjective ratings. Keep the evidence or scoring rubric with the value. The chart should not turn a subjective judgment into an apparently precise measurement.
Axis order
Keep axis order consistent across comparisons. Reordering axes changes the shape even when the underlying values are unchanged. Use the same ordering for every comparison. A changed shape may come from layout choices rather than a changed underlying profile.
Series
Limit overlapping series and label them clearly. Too many filled shapes make differences difficult to interpret. Label series clearly and avoid relying on color alone. Supporting values should remain available for readers who need a precise comparison.
Interpretation
Discuss individual dimensions and limitations. Do not infer an accurate total performance ranking from the polygon’s area. Explain limitations alongside the conclusion. A visual profile can prompt useful questions without establishing an objective overall winner.
How to complete the template
Prepare the supporting data table first. Check that each dimension has a meaningful definition and that scales are comparable. Explain normalization and direction, particularly if a lower raw value is better for one measure. Keep axis order fixed across comparisons. Use clear labels and limit the number of overlapping series so the chart remains readable.
Worked example
A team compares three service options across cost suitability, delivery speed, support, and integration using a defined one-to-five rubric. Cost is scored so that higher means more suitable, matching the direction of the other axes. The chart includes a supporting table and explains the subjective ratings. The team reviews weak dimensions rather than declaring the largest shape automatically best.
Check accuracy before use
Compare the chart with the source table and inspect missing values, inconsistent scales, and reversed directions. Do not let a blank score be interpreted as a genuine zero without explanation. Check how the profile looks in grayscale or a small display. Discuss specific dimensions rather than treating the apparent polygon area as a valid total score.
Related resources for the next step
Use Excel dashboard templates to present the chart with supporting measures.
Use survey templates to collect structured ratings.
Use price comparison templates to keep a transparent cost comparison alongside the visual.
Turn the scorecard into a useful radar chart
Imagine comparing two project-management tools on ease of use, reporting, integrations, and permission controls. Define each dimension before scoring. For permissions, a zero might mean anyone with access can change project settings, while a five means the team tested the exact role restrictions it needs. Ask reviewers to use the same evidence and scoring scale for both tools.
Complete one dimension before moving to the next
In the Excel scorecard, use the Dimension column for the criterion and the Definition column for the behavior you’re measuring. Put each tool’s score in its own option column, and use Target for the minimum useful score if you display it. Give any unclear score a note. For example, one tool may get a 2 on reporting because its export lacks the date filters your monthly review requires.
Build the chart from the comparison columns
Select the dimension names and the score columns you want to plot. In Excel, insert a radar chart and confirm that the legend lists the options. If the legend shows the dimensions instead, switch the data orientation so each option is a separate series. Keep the scale consistent with your scoring rubric and look for scores that fall below target on important criteria.
Read each spoke in context
The shape highlights differences, but the filled area is a poor basis for choosing a winner. Reordering the dimensions can change the shape without changing the scores. Read the underlying numbers and notes. If one missing permission blocks adoption, a strong score elsewhere won’t resolve that decision. Put must-have criteria in a short separate list before discussing the overall chart.
Make the next review comparable
Save the test date, tool version and rating definitions beside the scorecard. Next time, re-run the same test rather than asking whether the product feels better. For an untested feature, leave the score blank and mark it as untested in Notes. Zero is a tested result and tells a different story. Review how your radar chart displays blank values before sharing it.
Use a table for close comparisons
With several options, lines may overlap and obscure small differences. A simple table with one row per criterion can make it clearer that two tools scored the same on reporting but one missed the permissions threshold. Keep the chart as an overview and show the individual ratings in the same workbook so colleagues can verify the conclusion.

You must be logged in to post a comment.